 하나씩 점을 찍어 나가며
지리 데이터 시각화 라이브러리인 folium 쓰다가, 공식 도큐먼트를 보고 조금 놀랐다.
documentation을 비롯한 examples 들이 생각보다 잘 정리되었기 때문… 정말 이래야 쓸 맛이 난다.
Folium, 지리 데이터 시각화 라이브러리
folium 은 leaflet.js 를 파이썬 + 쥬피터에서 쓸 수 있게 만들어놓은 라이브러리다. 이전에 웹에서 지도를 그려본 사람이라면 leaflet 을 알텐데, 뭐 여하튼 경량화 되어있고, 모바일에도 최적화되어있는 유명한 라이브러리다. 아무튼, 이런 라이브러리를 파이썬에서 사용할 수 있는건, 꽤나 강력하다는 생각이 든다.
folium 공식 깃허브
https://github.com/python-visualization/foliumfolium 공식 documentation
https://python-visualization.github.io/folium/
처음 알게된 접해본 사람이라면, 먼저 공식 documentation 에서 Getting Started 로 어떻게 쓰는건지 대략 감을 잡기를 추천하고, 이후 깃허브 page에 examples 를 살펴보면, 어떤 기능들을 어떻게 사용하고 어떻게 시각화되는지 바로바로 보기를 권장한다.
이번 글에서는, folium의 plugin 패키지에 있는 기능들 example을 살펴보려 한다.
folium의 다른 기능들은 사실 잘 설명되어있는데, plugin 패키지에 있는 애들은 뚜렷히 뭘 하는건지 결과물을 볼 수가 없다.
사실 아래 사진에 보이듯, 깃허브에 엄청 훌륭하게 examples 파일들이 모아져 있긴 하다만, plugins.ipynb 및 샘플 예제들이 제대로 뜨지를 않아, 해당 내용을 여기에 그대로 실행해보려 한다.
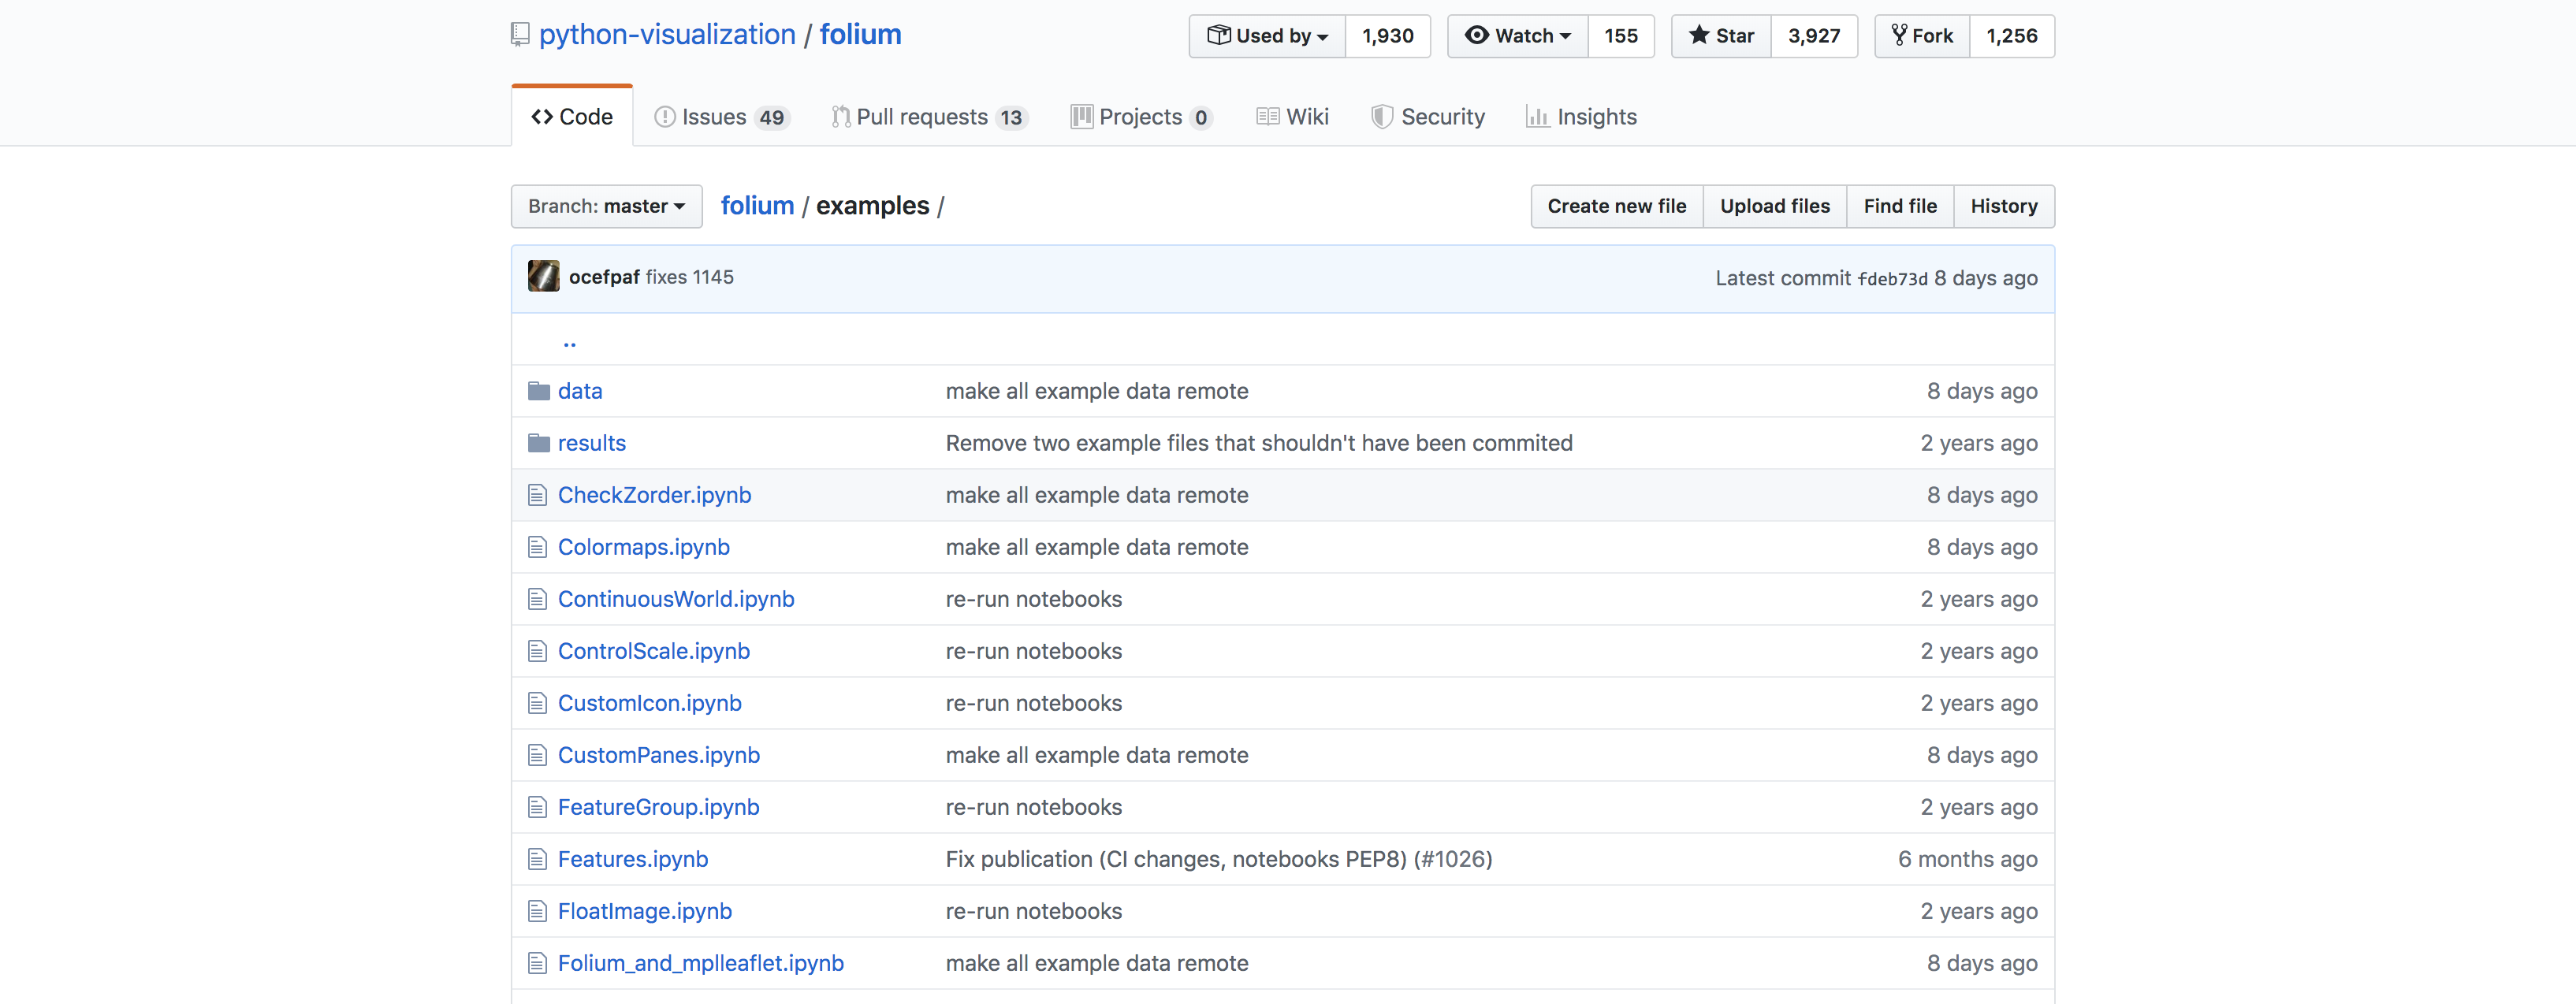
*생각보다 겁나 샘플예제가 엄청 잘되있다.
Examples of plugins usage in folium
import os

import numpy as np

import folium
from folium import plugins

print(folium.__version__)0.9.0In this notebook we show a few illustrations of folium's plugin extensions. These are available after importing folium.plugins.
ScrollZoomToggler
Adds a button to enable/disable zoom scrolling.
m = folium.Map([45, 3], zoom_start=4)

plugins.ScrollZoomToggler().add_to(m)

m.save(os.path.join('results', 'Plugins_0.html'))

m
MarkerCluster
Adds a MarkerCluster layer on the map.
N = 100
data = np.array(
    [
        np.random.uniform(low=35, high=60, size=N),  # Random latitudes in Europe.
        np.random.uniform(low=-12, high=30, size=N),  # Random longitudes in Europe.
    ]
).T
popups = [str(i) for i in range(N)] # Popups texts are simple numbers.

m = folium.Map([45, 3], zoom_start=4)

plugins.MarkerCluster(data, popups=popups).add_to(m)

m.save(os.path.join('results', 'Plugins_1.html'))
m
Terminator
m = folium.Map([45, 3], zoom_start=1)

plugins.Terminator().add_to(m)

m.save(os.path.join('results', 'Plugins_2.html'))
m
BoatMarker
m = folium.Map([30, 0], zoom_start=3)

plugins.BoatMarker(
    location=(34, -43),
    heading=45,
    wind_heading=150,
    wind_speed=45,
    color='#8f8'
).add_to(m)

plugins.BoatMarker(
    location=(46, -30),
    heading=-20,
    wind_heading=46,
    wind_speed=25,
    color='#88f'
).add_to(m)

m.save(os.path.join('results', 'Plugins_3.html'))
m
BeautifyIcon
m = folium.Map([45.5, -122], zoom_start=3)

icon_plane = plugins.BeautifyIcon(
    icon='plane',
    border_color='#b3334f',
    text_color='#b3334f',
    icon_shape='triangle')

icon_number = plugins.BeautifyIcon(
    border_color='#00ABDC',
    text_color='#00ABDC',
    number=10,
    inner_icon_style='margin-top:0;')

folium.Marker(
    location=[46, -122],
    popup='Portland, OR',
    icon=icon_plane
).add_to(m)

folium.Marker(
    location=[50, -122],
    popup='Portland, OR',
    icon=icon_number
).add_to(m)

m.save(os.path.join('results', 'Plugins_4.html'))
m
Fullscreen
m = folium.Map(location=[41.9, -97.3], zoom_start=4)

plugins.Fullscreen(
    position='topright',
    title='Expand me',
    title_cancel='Exit me',
    force_separate_button=True
).add_to(m)

m.save(os.path.join('results', 'Plugins_5.html'))
m
Timestamped GeoJSON
m = folium.Map(
    location=[35.68159659061569, 139.76451516151428],
    zoom_start=16
)

# Lon, Lat order.
lines = [
    {
        'coordinates': [
            [139.76451516151428, 35.68159659061569],
            [139.75964426994324, 35.682590062684206],
        ],
        'dates': [
            '2017-06-02T00:00:00',
            '2017-06-02T00:10:00'
        ],
        'color': 'red'
    },
    {
        'coordinates': [
            [139.75964426994324, 35.682590062684206],
            [139.7575843334198, 35.679505030038506],
        ],
        'dates': [
            '2017-06-02T00:10:00',
            '2017-06-02T00:20:00'
        ],
        'color': 'blue'
    },
    {
        'coordinates': [
            [139.7575843334198, 35.679505030038506],
            [139.76337790489197, 35.678040905014065],
        ],
        'dates': [
            '2017-06-02T00:20:00',
            '2017-06-02T00:30:00'
        ],
        'color': 'green',
        'weight': 15,
    },
    {
        'coordinates': [
            [139.76337790489197, 35.678040905014065],
            [139.76451516151428, 35.68159659061569],
        ],
        'dates': [
            '2017-06-02T00:30:00',
            '2017-06-02T00:40:00'
        ],
        'color': '#FFFFFF',
    },
]

features = [
    {
        'type': 'Feature',
        'geometry': {
            'type': 'LineString',
            'coordinates': line['coordinates'],
        },
        'properties': {
            'times': line['dates'],
            'style': {
                'color': line['color'],
                'weight': line['weight'] if 'weight' in line else 5
            }
        }
    }
    for line in lines
]

plugins.TimestampedGeoJson({
    'type': 'FeatureCollection',
    'features': features,
}, period='PT1M', add_last_point=True).add_to(m)

m.save(os.path.join('results', 'Plugins_6.html'))
m
table = """\
<table style=\'width:100%\'>
<tr>
<th>Firstname</th>
<th>Lastname</th>
<th>Age</th>
</tr>
<tr>
<td>Jill</td>
<td>Smith</td>
<td>50</td>
</tr>
<tr>
<td>Eve</td>
<td>Jackson</td>
<td>94</td>
</tr>
</table>
"""
points = [
{
'time': '2017-06-02',
'popup': '<h1>address1</h1>',
'coordinates': [-2.548828, 51.467697]
},
{
'time': '2017-07-02',
'popup': '<h2 style=\'color:blue;\'>address2<h2>',
'coordinates': [-0.087891, 51.536086]
},
{
'time': '2017-08-02',
'popup': '<h2 style=\'color:orange;\'>address3<h2>',
'coordinates': [-6.240234, 53.383328]
},
{
'time': '2017-09-02',
'popup': '<h2 style=\'color:green;\'>address4<h2>',
'coordinates': [-1.40625, 60.261617]},
{
'time': '2017-10-02',
'popup': table,
'coordinates': [-1.516113, 53.800651]}
]
features = [
{
'type': 'Feature',
'geometry': {
'type': 'Point',
'coordinates': point['coordinates'],
},
'properties': {
'time': point['time'],
'popup': point['popup'],
'id': 'house',
'icon': 'marker',
'iconstyle': {
'iconUrl': 'http://downloadicons.net/sites/default/files/small-house-with-a-chimney-icon-70053.png',
'iconSize': [20, 20]
}
}
} for point in points
]
features.append(
{
'type': 'Feature',
'geometry': {
'type': 'LineString',
'coordinates': [
[-2.548828, 51.467697],
[-0.087891, 51.536086],
[-6.240234, 53.383328],
[-1.40625, 60.261617],
[-1.516113, 53.800651]
],
},
'properties': {
'popup': 'Current address',
'times': [
'2017-06-02',
'2017-07-02',
'2017-08-02',
'2017-09-02',
'2017-10-02'
],
'icon': 'circle',
'iconstyle': {
'fillColor': 'green',
'fillOpacity': 0.6,
'stroke': 'false',
'radius': 13
},
'style': {'weight': 0},
'id': 'man'
}
}
)
m = folium.Map(
location=[56.096555, -3.64746],
tiles='cartodbpositron',
zoom_start=5,
)
plugins.TimestampedGeoJson(
{
'type': 'FeatureCollection',
'features': features
},
period='P1M',
add_last_point=True,
auto_play=False,
loop=False,
max_speed=1,
loop_button=True,
date_options='YYYY/MM/DD',
time_slider_drag_update=True,
duration='P2M'
).add_to(m)
m.save(os.path.join('results', 'Plugins_7.html'))
mFeatureGroupSubGroup
Sub categories
Disable all markers in the category, or just one of the subgroup.
m = folium.Map(location=[0, 0], zoom_start=6)

fg = folium.FeatureGroup(name='groups')
m.add_child(fg)

g1 = plugins.FeatureGroupSubGroup(fg, 'group1')
m.add_child(g1)

g2 = plugins.FeatureGroupSubGroup(fg, 'group2')
m.add_child(g2)

folium.Marker([-1, -1]).add_to(g1)
folium.Marker([1, 1]).add_to(g1)

folium.Marker([-1, 1]).add_to(g2)
folium.Marker([1, -1]).add_to(g2)

folium.LayerControl(collapsed=False).add_to(m)
m.save(os.path.join('results', 'Plugins_8.html'))
m
Marker clusters across groups
Create two subgroups, but cluster markers together.
m = folium.Map(location=[0, 0], zoom_start=6)

mcg = folium.plugins.MarkerCluster(control=False)
m.add_child(mcg)

g1 = folium.plugins.FeatureGroupSubGroup(mcg, 'group1')
m.add_child(g1)

g2 = folium.plugins.FeatureGroupSubGroup(mcg, 'group2')
m.add_child(g2)

folium.Marker([-1, -1]).add_to(g1)
folium.Marker([1, 1]).add_to(g1)

folium.Marker([-1, 1]).add_to(g2)
folium.Marker([1, -1]).add_to(g2)

folium.LayerControl(collapsed=False).add_to(m)
m.save(os.path.join('results', 'Plugins_9.html'))
m
Minimap
Adds a locator minimap to a folium document.
m = folium.Map(location=(30, 20), zoom_start=4)

minimap = plugins.MiniMap()
m.add_child(minimap)

m.save(os.path.join('results', 'Plugins_10.html'))
m
DualMap
The DualMap plugin can be used to display two maps side by side, where panning and zooming is syncronized.
The DualMap class can be used just like the normal Map class. The two sub-maps can be accessed with its m1 and m2 attributes.
m = plugins.DualMap(location=(52.1, 5.1), tiles=None, zoom_start=8)

folium.TileLayer('cartodbpositron').add_to(m.m2)
folium.TileLayer('openstreetmap').add_to(m)

fg_both = folium.FeatureGroup(name='markers_both').add_to(m)
fg_1 = folium.FeatureGroup(name='markers_1').add_to(m.m1)
fg_2 = folium.FeatureGroup(name='markers_2').add_to(m.m2)

icon_red = folium.Icon(color='red')
folium.Marker((52, 5), tooltip='both', icon=icon_red).add_to(fg_both)
folium.Marker((52.4, 5), tooltip='left').add_to(fg_1)
folium.Marker((52, 5.4), tooltip='right').add_to(fg_2)

folium.LayerControl(collapsed=False).add_to(m)
m.save(os.path.join('results', 'Plugins_11.html'))
m
Locate control
Adds a control button that when clicked, the user device geolocation is displayed.
To work properly in production, the connection needs to be encrypted, otherwise browser will not
allow users to share their location.
m = folium.Map([41.97,2.81])

plugins.LocateControl().add_to(m)

# If used with Draw plugin, LocateControl needs to be added before it.
# Draw().add_to(m)

m
Heatmap
import numpy as np

data = (
    np.random.normal(size=(100, 3)) *
    np.array([[1, 1, 1]]) +
    np.array([[48, 5, 1]])
).tolist()
from folium.plugins import HeatMap
m = folium.Map([48., 5.], tiles='stamentoner', zoom_start=6)
HeatMap(data).add_to(m)
m.save(os.path.join('results', 'Heatmap.html'))
mHeatMapWithTime
In this example we show the most basic usage of the HeatMapWithTime plugin.
We generate a random set of points with lat/lon coordinates to draw on the map, and then move these points slowly in a random direction to simulate a time dimension. The points are aranged into a list of sets of data to draw.
import folium
import folium.plugins as plugins
import numpy as np

np.random.seed(3141592)
initial_data = (
    np.random.normal(size=(100, 2)) * np.array([[1, 1]]) +
    np.array([[48, 5]])
)

move_data = np.random.normal(size=(100, 2)) * 0.01

data = [(initial_data + move_data * i).tolist() for i in range(100)]

weight = 1  # default value
for time_entry in data:
    for row in time_entry:
        row.append(weight)
m = folium.Map([48., 5.], tiles='stamentoner', zoom_start=6)
hm = plugins.HeatMapWithTime(data)
hm.add_to(m)
mNow we show that the time index can be specified, allowing a more meaningful representation of what the time steps mean. We also enable the 'auto_play' option and change the maximum opacity. See the docmentation for a full list of options that can be used.
from datetime import datetime, timedelta


time_index = [
    (datetime.now() + k * timedelta(1)).strftime('%Y-%m-%d') for
    k in range(len(data))
]
m = folium.Map([48., 5.], tiles='stamentoner', zoom_start=6)
hm = plugins.HeatMapWithTime(
data,
index=time_index,
auto_play=True,
max_opacity=0.3
)
hm.add_to(m)
m출처
'데이터와 함께 탱고를 > 데이터 시각화' 카테고리의 다른 글
| 이제는 matplotlib 말고, Plotly 를 쓰자. (7) | 2019.08.17 |
|---|---|
| pandas, bar 그래프(plot) 이쁘게 그리기 (2) | 2019.06.18 |
| pyplot 그래프의 범주박스 위치 변경하기 (0) | 2019.06.14 |
| folium 의 plugins 패키지 샘플 살펴보기 2 (0) | 2019.06.03 |
| 파이썬으로 데이터 시각화하기 1편. matplotlib. (1) | 2019.03.27 |


